 PART OF FORWARD GROUP

A management dashboard for a business no longer requires a BI system, licenses and a data team. A customer planning a business conference needed one answer: how many registrants are needed to avoid a loss, and what is the biggest risk along the way. With AI we built for him a sensitivity analysis dashboard in Google Sheets, based on the decisions made in the meeting, and it showed where the risk really lies.
Why BI systems are no longer a must for a small or medium business
BI systems were built for a world where every report required a developer, a data model and a license for every user. In a small or medium business this usually ends in an expensive dashboard nobody opens, or an Excel file only one person understands.
The case from the field: a management dashboard for a business conference
The customer planned a business conference at a hotel. In the meeting they decided ticket prices, a VIP track, a discount for existing customers and a bring a friend promotion. What was not clear: does the conference make money, at how many registrants, and what happens if the discounts do not materialize.
Instead of a BI system or a spreadsheet of hundreds of rows, we built one dashboard in Google Sheets, in which all the numbers derive from a single assumptions tab.
What the dashboard does
Choose a scenario
Four yellow cells: how many registrants, the minimum registrants the venue charges for, the share of existing customers and the share of VIP. Change a value and all the numbers and the chart update immediately.
The result at a glance
Profit or loss, the break even point (how many registrants are needed), net income per registrant, cost per registrant, and how much empty places that are paid for cost.
Sensitivity analysis
Three tables that answer three questions: how much the venue's minimum costs, what happens when more existing customers arrive with a discount, and how much the VIP track really helps.
Open for approval
A tab that collects every assumption not yet approved, who needs to approve it and what it changes in the result. Decisions do not get lost between meetings.
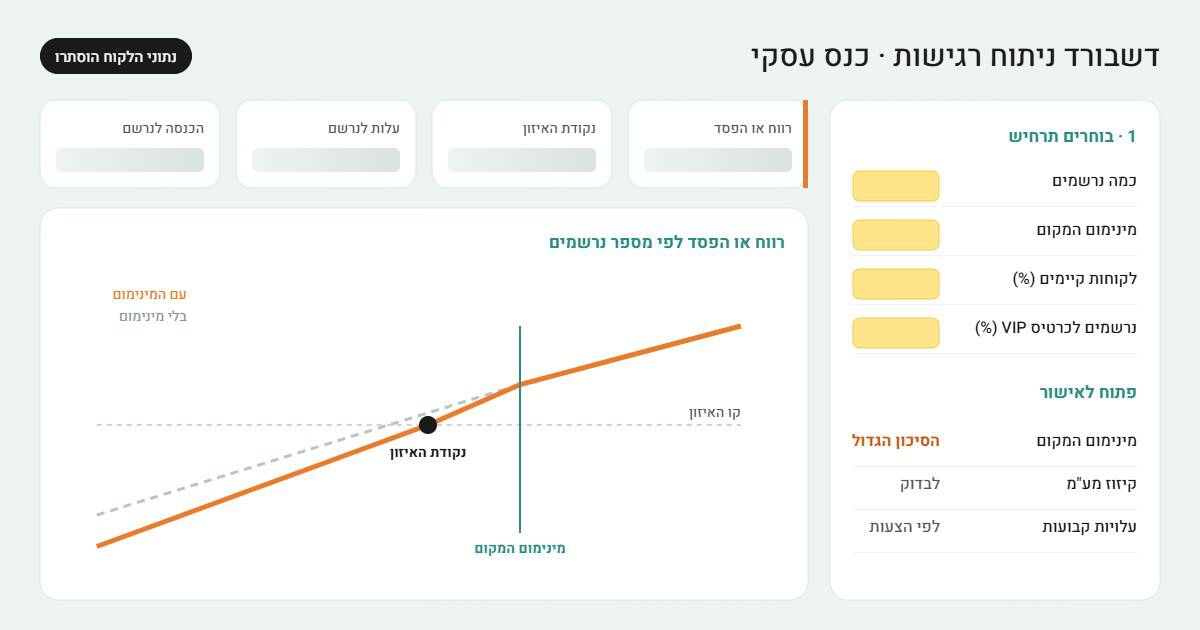
The dashboard structure. The numbers and the customer's name were hidden.
What the dashboard showed that nobody saw before
The big risk in the conference was not the ticket price but the minimum commitment to the hotel. Below the minimum, every empty place costs money, so the loss grows fast as there are fewer registrants. The chart shows two lines, with the minimum and without it, and the gap between them is exactly the amount worth negotiating over.
The conclusion became one task: negotiate the minimum before signing the contract. And in parallel track the share of existing customers, because every discount for them raises the break even point.
How to build a management dashboard for a business without a BI system
- Start from the question, not from the data: which decision the dashboard needs to enable.
- One assumptions tab, with fixed colors: input, an assumption waiting for approval, and a formula. Everything else derives from it.
- AI builds the formulas, the sensitivity tables and the integrity checks, and we check the logic against the customer.
- The dashboard updates after every meeting, and the open assumptions get closed one after another.
When you do still need a BI system
When there are millions of rows, many data sources that update all the time, or different permissions for each user, a BI system is still the right choice. For most decisions in a small or medium business, such as pricing, budget, feasibility and scenarios, a focused dashboard built with AI answers faster and at a much lower cost.
Frequently asked questions
What is a management dashboard for a business?
One screen that gathers the numbers needed to make a decision: revenue, costs, profit and break even point, with the ability to change assumptions and immediately see what happens.
What is sensitivity analysis?
A check of how the result changes when you change one assumption, for example the number of registrants or the discount rate. It shows which assumption really endangers the deal.
Do you need to pay for software?
No. The conference dashboard was built in Google Sheets, without a BI license. The cost is the time of building and checking with the customer.
Can you build such a dashboard for my business too?
Yes. It suits especially feasibility checks, pricing, events, opening a branch and any decision that depends on how many assumptions. Financial feasibility check · More Forward AI projects · AI implementation in a business.

